
Norway benchmarks its schools extensively, but the current (as of 2012) centre-left government isn't entirely completely comfortable with the practice and would like the results to be kept within the administration. They say they're happy with the 'calm' in the school system with regards to benchmarking, while the schools themselves are in turmoil over the continuous testing. Last year, higher numbers of abseentism from weaker students in Oslo showed that schools are keeping the weaker students out of tests to look better on the benchmaks.
This leaves me thinking that the problems with benchmarking schools does not come from us having access to the test results, but rather the perverse incentives that shift focus from knowledge to test performance. By publishing the data I wish to make the testing process visible and subject to debate.
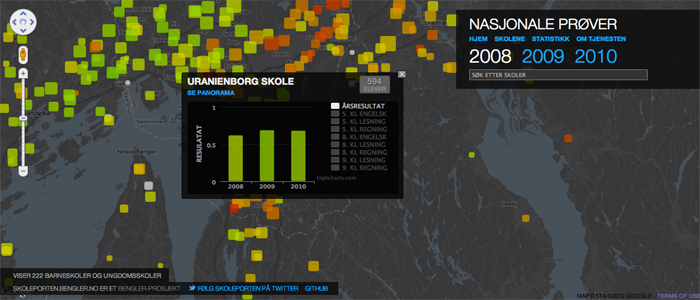
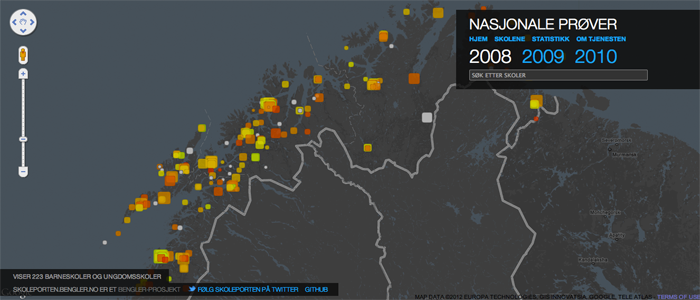
The Directorate of Education has even built a site that displays information on the schools and spent public money having their developers make a fine grained filter deciding who gets to see the actual benchmarks. However, they haven't exempted the information itself from the public. Through freedom of information requests the benchmarks from the past few years have been acquired. A simple Google Maps mashup has been built show school size and performance last year with drill down for individual subjects and years.
The site has been featured on Norwegian national news and this year the directorate has been very forthcoming with regards to my requests for this year's data and a request to further annotate the previous year's tests with organization numbers to allow for the creation of robust time series for each school.
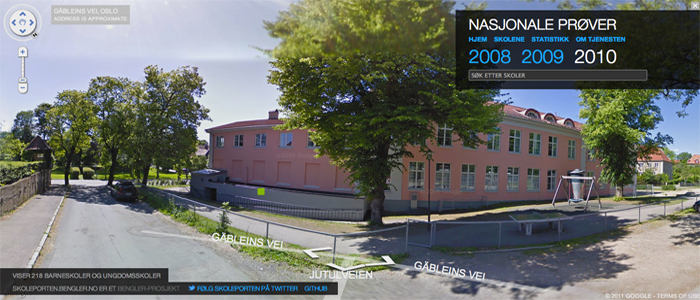
The site also does a quick lookup with Google Streetview and links to panoramas if they've been by with their little car.
The code, along with the data, is available on GitHub.
Related projects


Other projects
-

PANDA
Supercolluder for the gig economy
-
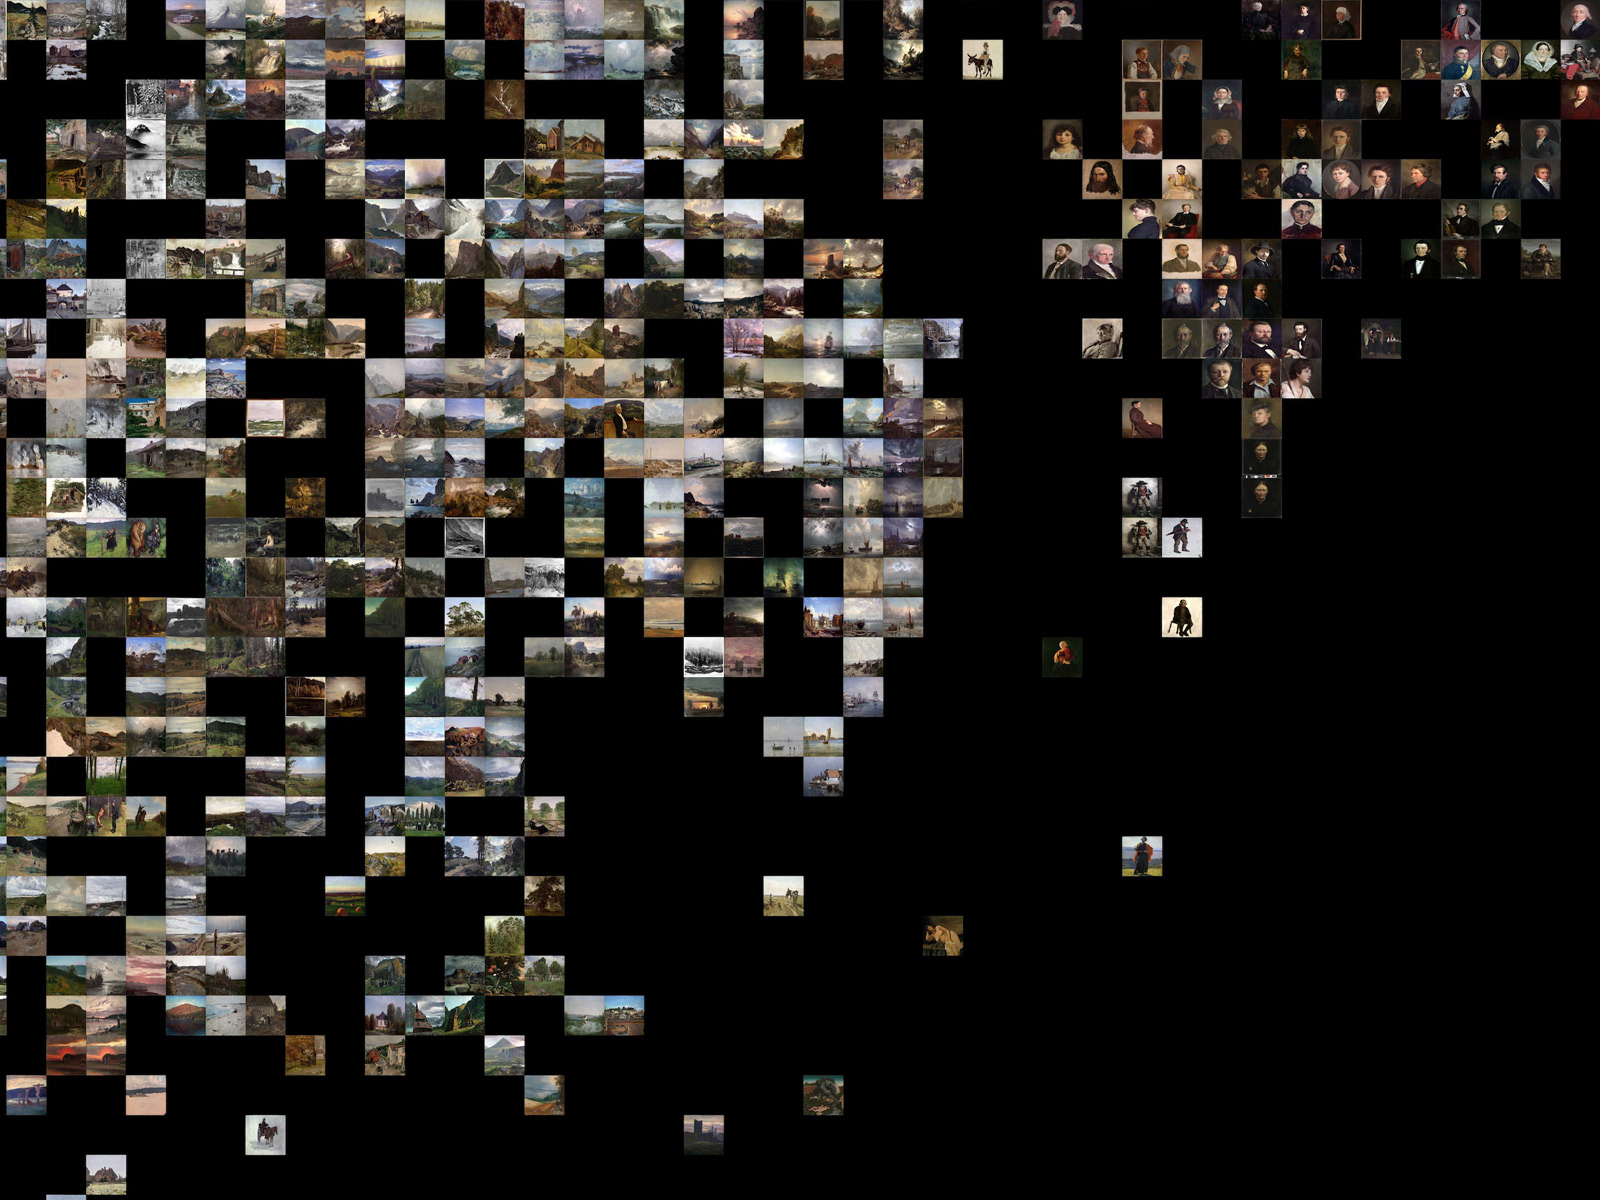
Principal Components
Machine learning in search of the uncanny
-
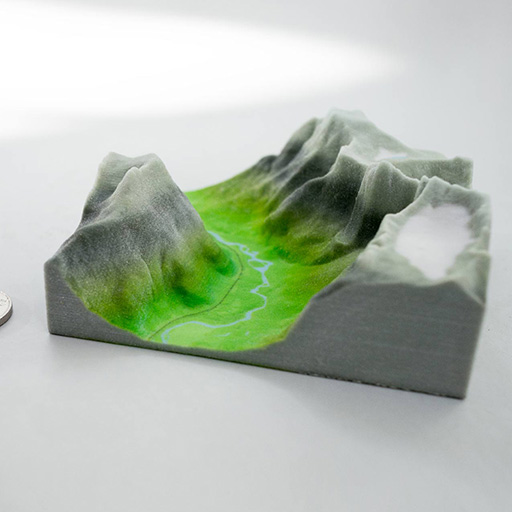
Terrafab
Own a small slice of Norway
-

OMA Website
Simple surface, intricate clockwork
-
Underskog
Friendly community for the Norwegian cultural fringe.
-
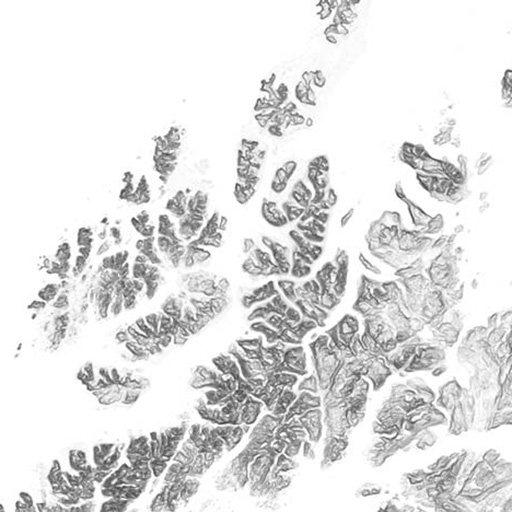
Mapfest!
Helping liberate Norwegian geodata
-
Chorderoy
Efficient text input for mobile and wearable devices
-
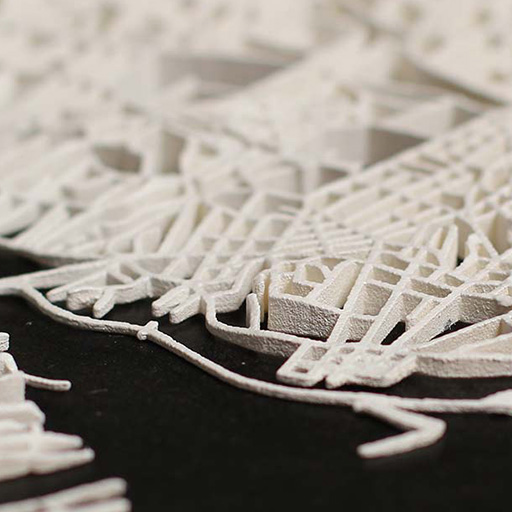
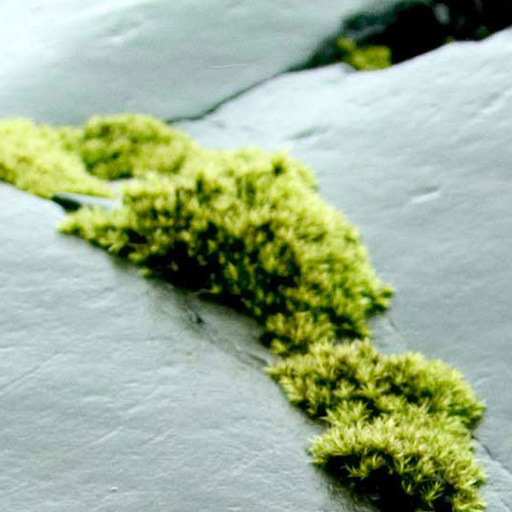
Intersections
Laser sintered topological maps for cars and social scientists