Project
Data analysis & visualization tool
Client
Ministry of Government Administration
Released
2013
License
Site
Grantonaut is a simple web-based application which allows you to explore Norwegian government innovation stimulation. More specifically it shows the grants, loans and financial guarantees flowing from Innovation Norway (IN) in the years from 2005 to 2011.
Innovation Norway?
In 2005 the Norwegian government combined a number of different agencies providing financial stimulus into one Organization: Innovation Norway. To quote their annual report of 2011:
IN has clear objectives, many tasks and big ambitions. We are the authorities' most important policy instrument and adviser in innovation policy, and we strive to make norway the world's most innovative country.
Every year they hand out some 3bn NOK (500m USD) in grants and loans each to Norwegian industry. The sunlight on this process is shed through annual reports and a flat list of grants available on their website:
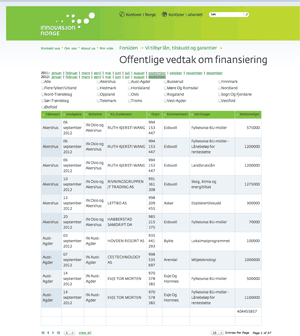
The government appointed committee on ICTs and value creation, Digitutvalget thought we perhaps could do a bit better and set up a project between vis.bengler.no and IN that allowed us access to their data under an agreement of confidentiality. Towards the project's completion parts of the agreement was lifted and a slice of the data made public. Thank you!
When perusing the data it may be worth keeping in mind that most of the funding flowing from IN is earmarked by the ministeries of Fisheries and Costal Affairs and Agriculture.
Notes on Usage and Data
Each chart is a dimension and you may filter the data using any combination of charts. To see examples of how you may use the filters choose EXAMPLES from the top right menu.
Economic Activities
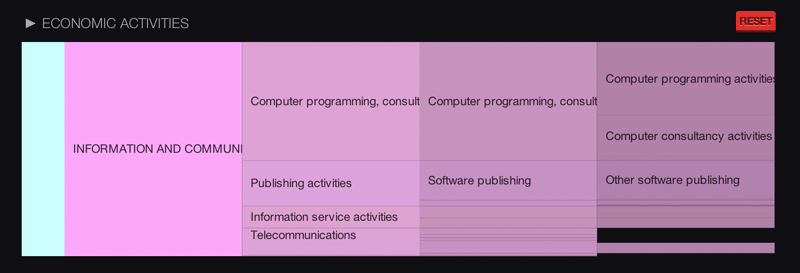
Click the headings to zoom and select categories for filtering.
Protip: The triangle on the top right hand corner expands the chart for easier selection.
Even though IN classifies every project according to the activity undertaken, they decided not to make this data public. The economic classification is therefore that which belongs to the client organization, not the project activity. Private individuals and projects on foreign soil therefore do not have an economic classification. There are thousands of cases marked Unclassified.
Mappings between projects and client organization economic activity has been provided by IN. The classifications are in EUs NACE Rev. 2 and have been aggregated into a hierarchy.
Search
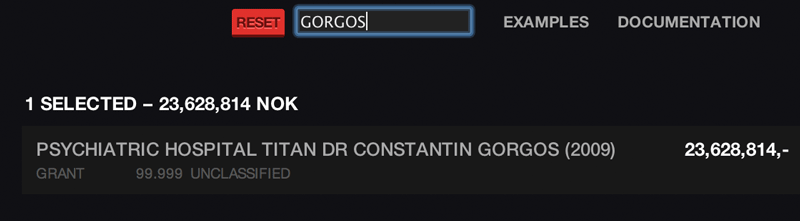
Fuzzy free text search for names of clients.
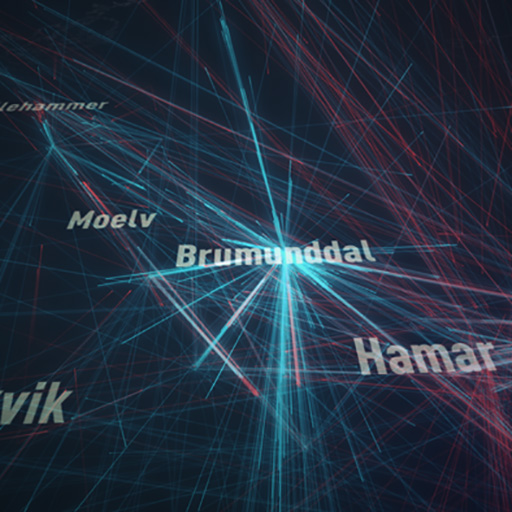
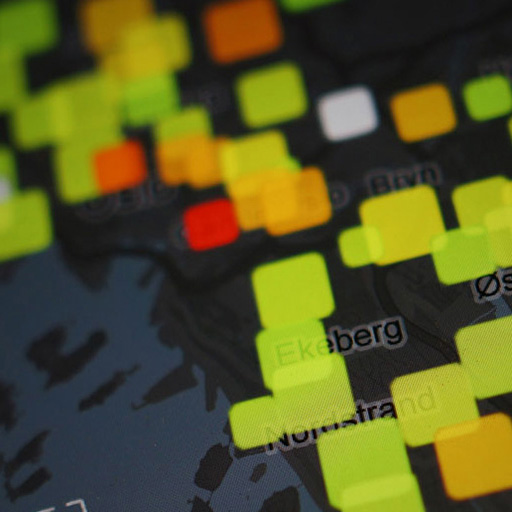
Geographical Distribution
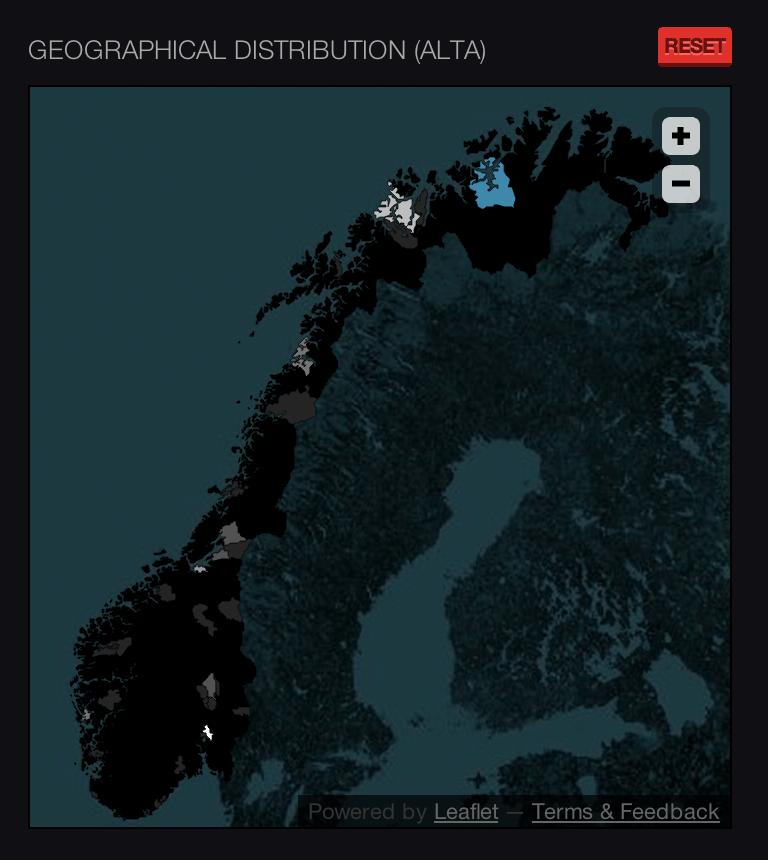
Shows the relative geographic distribution of where project funds have been spent. Red is high. Green is low. Click on the map to filter by municipality. Note: when looking at the entire set unfiltered the geographical distribution is something of a population map, but when filtering on other dimensions interesting patterns do appear.
Amount in NOK
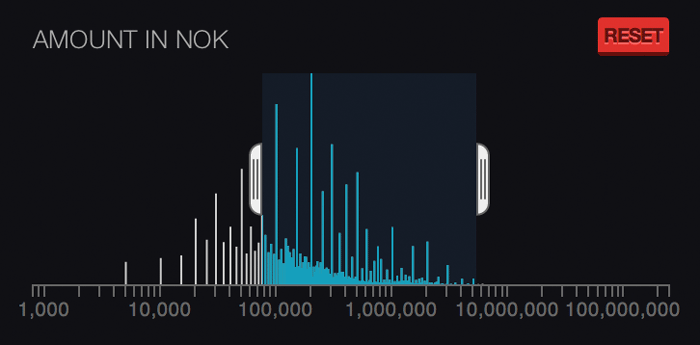
Relative frequency in the selection of grant or loan allotment in Norwegian Kroner. Click and drag to delimit by amount.
Year
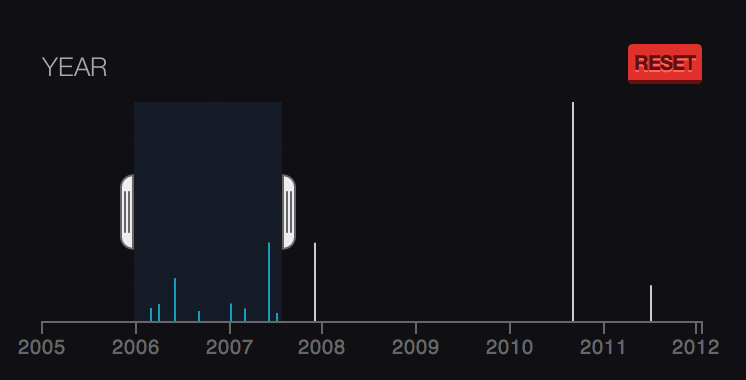
Relative amount allotted in the selection between the months of the project application. Click and drag to delimit by year.
Bringing it all together
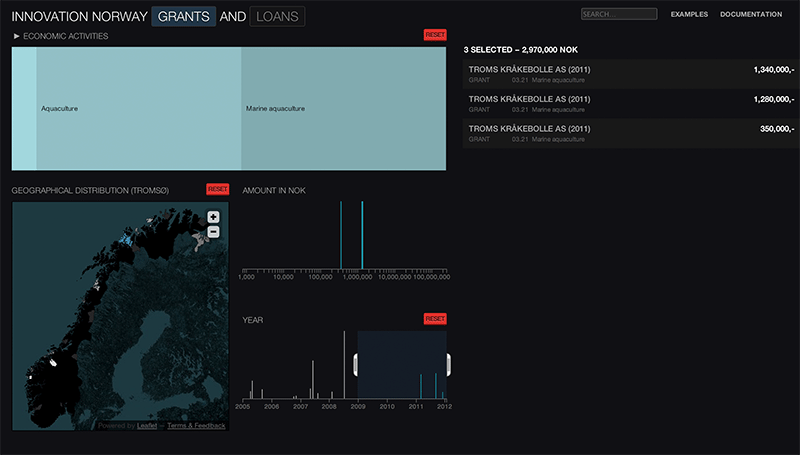
By combining filters you can easily put together queries like «Grants to aquaculture in Tromsø since 2009.»
Challenges
Companies in Europe have their activity categorized according to the EU NACE standard. The standard includes some 1200 categories and amongst them we find gems like Manufacture of instruments and appliances for measuring, testing and navigation and Manufacture of wood and of products of wood and cork, except furniture. Go on, check it out. You know you want to.
Unfortunately, the world is hardly static and in the 2000s the EU began work on an entirely new revision of the NACE standard. In 2006 they deployed NACE revision 2. Understandably this standard deprecates old categories and refines old ones into new eniterely categories. You can tell though that the EU people aren't great systems thinkers though – the new standard reuses deprecated codes for completely new categories. Their correspondance tables used to translate between old and new categories also contain quite a few strange mappings and seems at times rather arbitrary. There is also no given low resolution mapping between old codes and new. It would seem a better data model for NACE codes could have solved this just fine.
Organizations like IN are therefore left with tens of thousands of projects that they need to manually reclassfiy. This is not necessarily something they have time to do and are therefore left with old and new codes co-mingled in a single table and a huge headache whenever they need to make time series that run across the divide. To get around this I've used the somewhat banal approach of looking at the possible mappings from the correspondance tables and simply choosing the ones that most frequently appear in the new data. This is by no means a sterling 100% solution, but does seem to give continous data around the divide between NACE1 and NACE2.
Development
I wasn't originally trying to see how many things Mike Bostock i could cram into one project. But yes, the multivariate filtering is carried out by his excellent Crossfilter library and the charts are built with his excellent D3. Almost all of it is assembled from sample code from the respective projects. An awkward bear hug of a thank you is therefore owed to Mike and the various contributors to these projects. Halfway through I also ran into random behaviour that turned out to be a bug in Chrome's JIT compiler that was kindly reported to the Chromium team by Jason Davies. Google has since patched the error and deployed it to the stable release. Davies should also be thanked for his Support Custom Filter Functions patch to Crossfilter. It pains me to report that the project currently doesn't run in the Opera browser, which chokes on Crossfilter for some arcane reason.
Grantonaut is an interface prototype and somewhat exceeds the specification for what one would typically offer to a broader audience. This goes both for the complexity of the interface and demands made on browsers and hardware. It runs fine under Safari, Firefox and stock Chrome distributions. For the slickest presentation getting Chrome Canary may be a good idea.
Disclosure
This project has been partially funded by the government appointed committee for ICTs and Innovation through the Ministry of Government Administration, Reform and Church Affairs.
Related projects

Other projects
-

PANDA
Supercolluder for the gig economy
-
Principal Components
Machine learning in search of the uncanny
-
Terrafab
Own a small slice of Norway
-

OMA Website
Simple surface, intricate clockwork
-

Underskog
Friendly community for the Norwegian cultural fringe.
-
Mapfest!
Helping liberate Norwegian geodata
-
Chorderoy
Efficient text input for mobile and wearable devices
-

Intersections
Laser sintered topological maps for cars and social scientists