
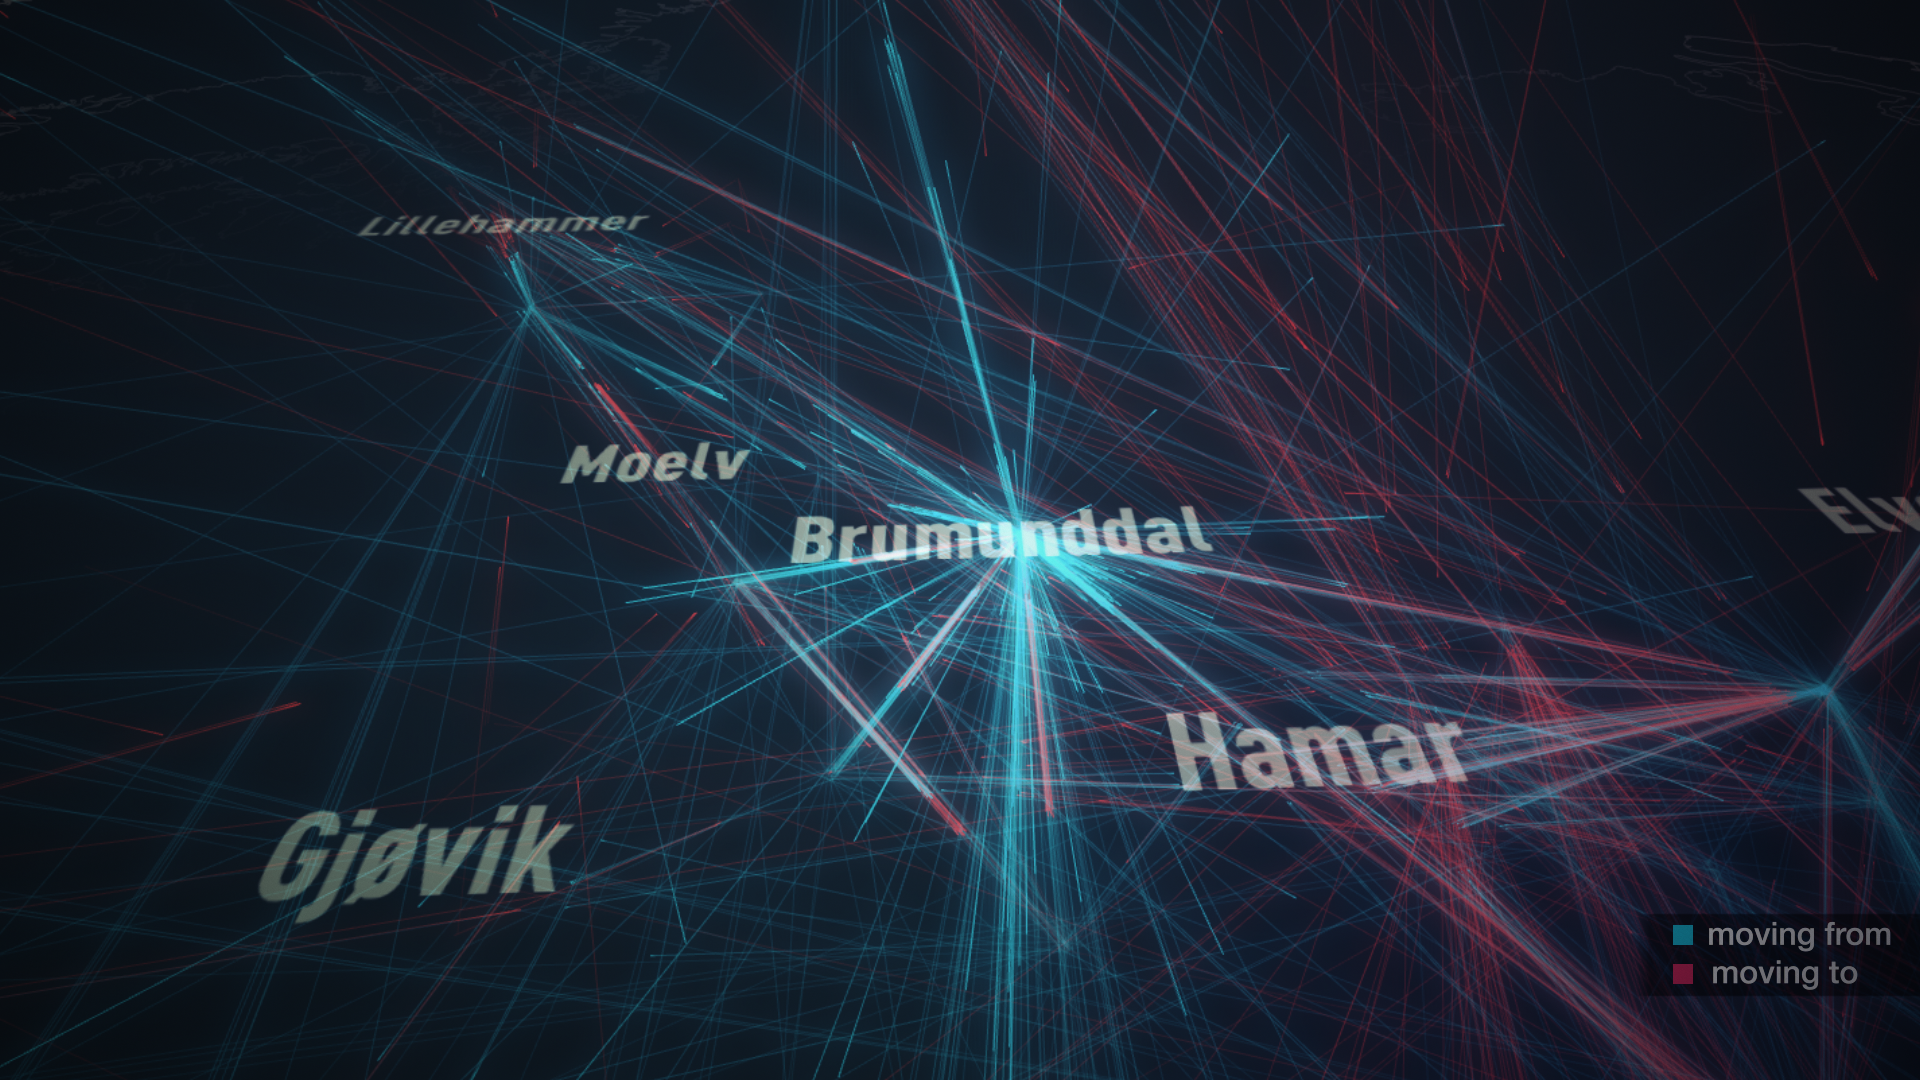
300.000 Norwegians move house every year. If the pattern made by their travels could be compressed into one short animation, what would it look like? What could you learn from it, if anything? Deluge is a C++ application designed to answer these questions. The data was generated by cross referencing 8 million tax records from 2006 and 2007 to track changes in postal codes.
Norwegian tax returns
In Norway the incomes and fortunes of all tax paying individuals are made public every year! Historically the records were only available as printed matter, but at some point the tax authorities decided to make the records available to news organisations as machine readable files. Though it may seem radical I believe this practice could be beneficial in a social democracy with a high level of personal taxation and a working welfare system. The press occasionally runs a few stories on monied individuals with clever accountants, so this seems to work to a certain degree.
In addition to these beneficial stories the press has used this data for a few other not so awesome things: news on celebrity earnings and SEO optimized pages for every single tax payer. So these pages we constantly stumble across on Google when simply were trying find someone's phone number.
Data as granular as this is usually reserved for government administration, not handed out to the press. The data set lists over 4 million individuals. It contains full name, year of birth, postal code and their attendant financial data. I thought there might be some novel uses this information could be put to and asked if I could have a hard look at it on behalf of the news organization our company works with.
Uniquing tax payers
It seemed interesting to track people across years and it turns out only 70.000 Norwegians are not unique by name and year of birth. If you subtract these you're left with 3.950.000 unique tax payers. As we have the postal codes for each person we can track who moved between 2006 and 2007.
Crowdsourced postal code locations
The practice of transparency regarding tax returns should not be taken to indicate that public Norwegian agencies are extremely generous with their data. Even though we have everyone's income listed on Google the Norwegian postal agency doesn't publish the positions or bounds of postal codes. Yet, thanks to a private initiative by Erik Bolstad, this information has been made public through a crowdsourced effort (awesome).
Initial sketch
A sketch was made with a subset of the data in a 3D software package. It had a limit of a few thousand particles, but it did seem somewhat promising
Under 35 year olds with under 100.000 Norwegian kroners income.
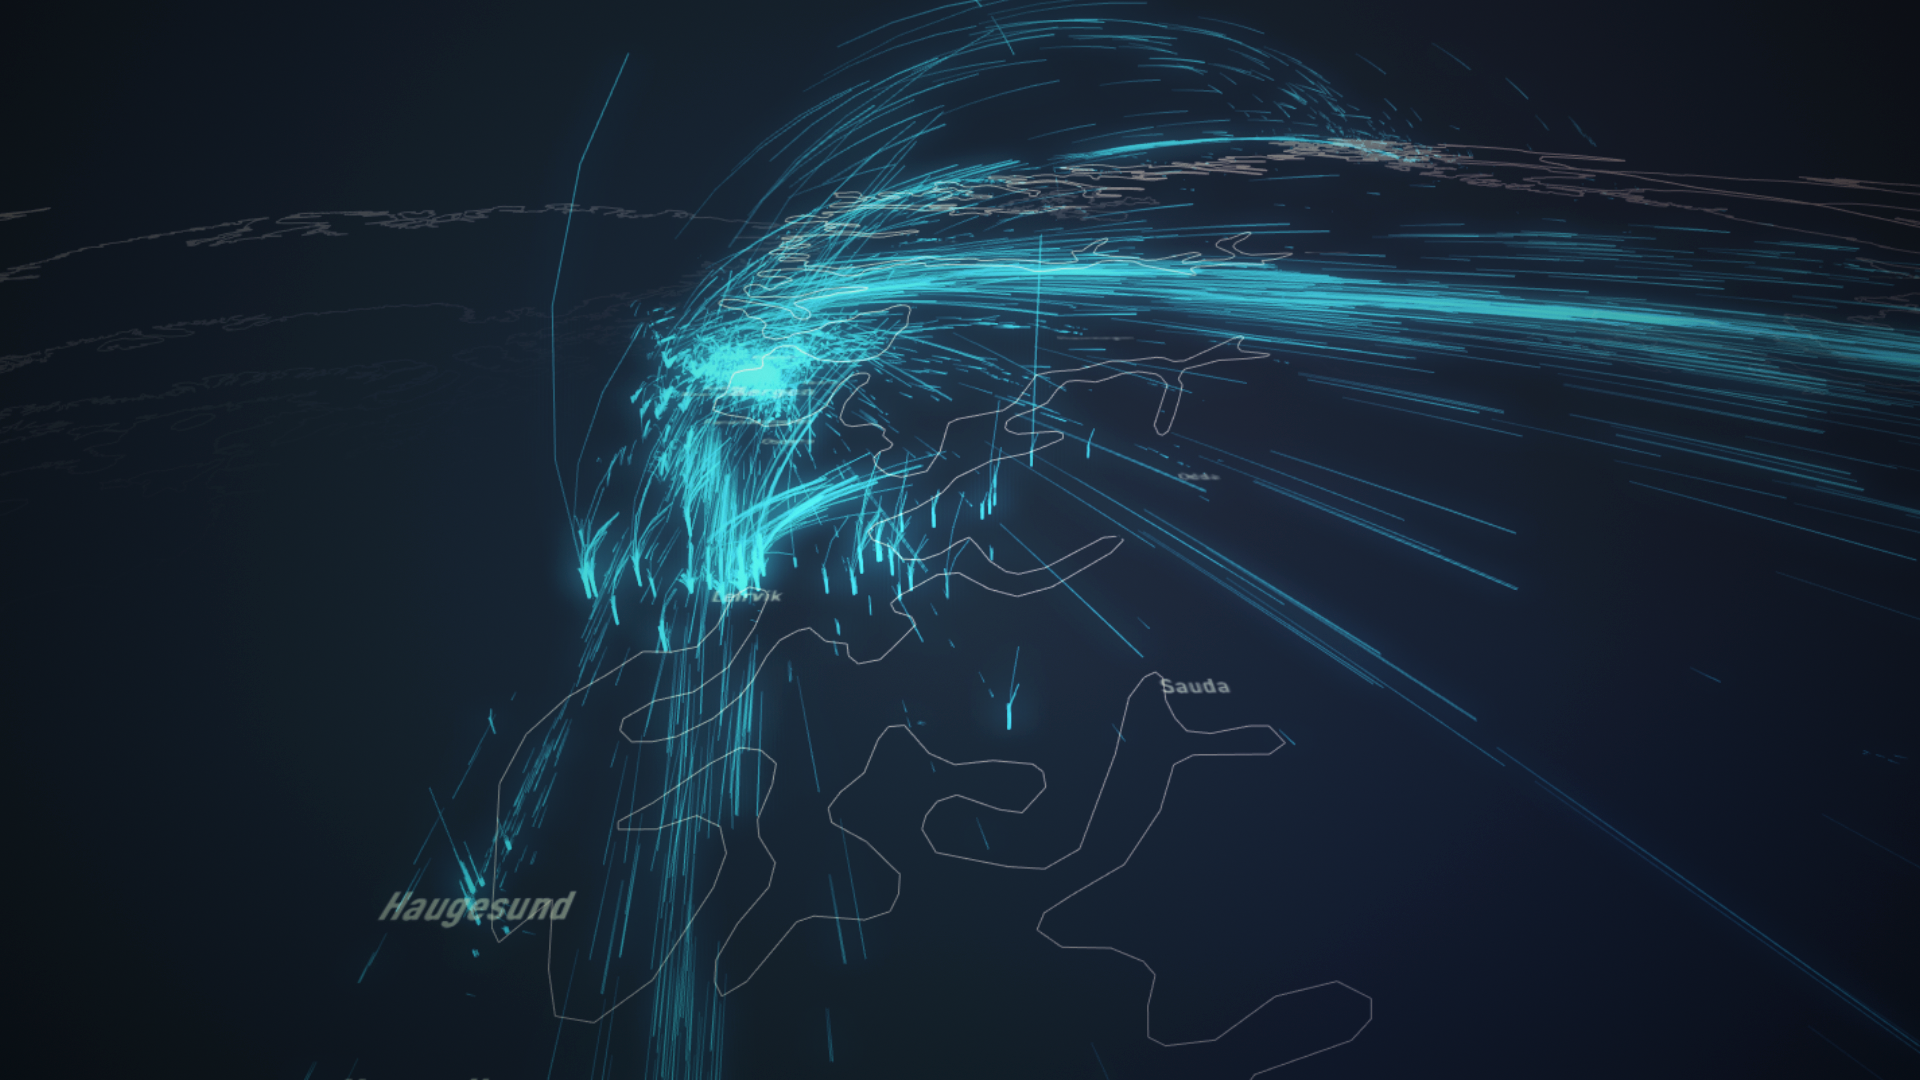
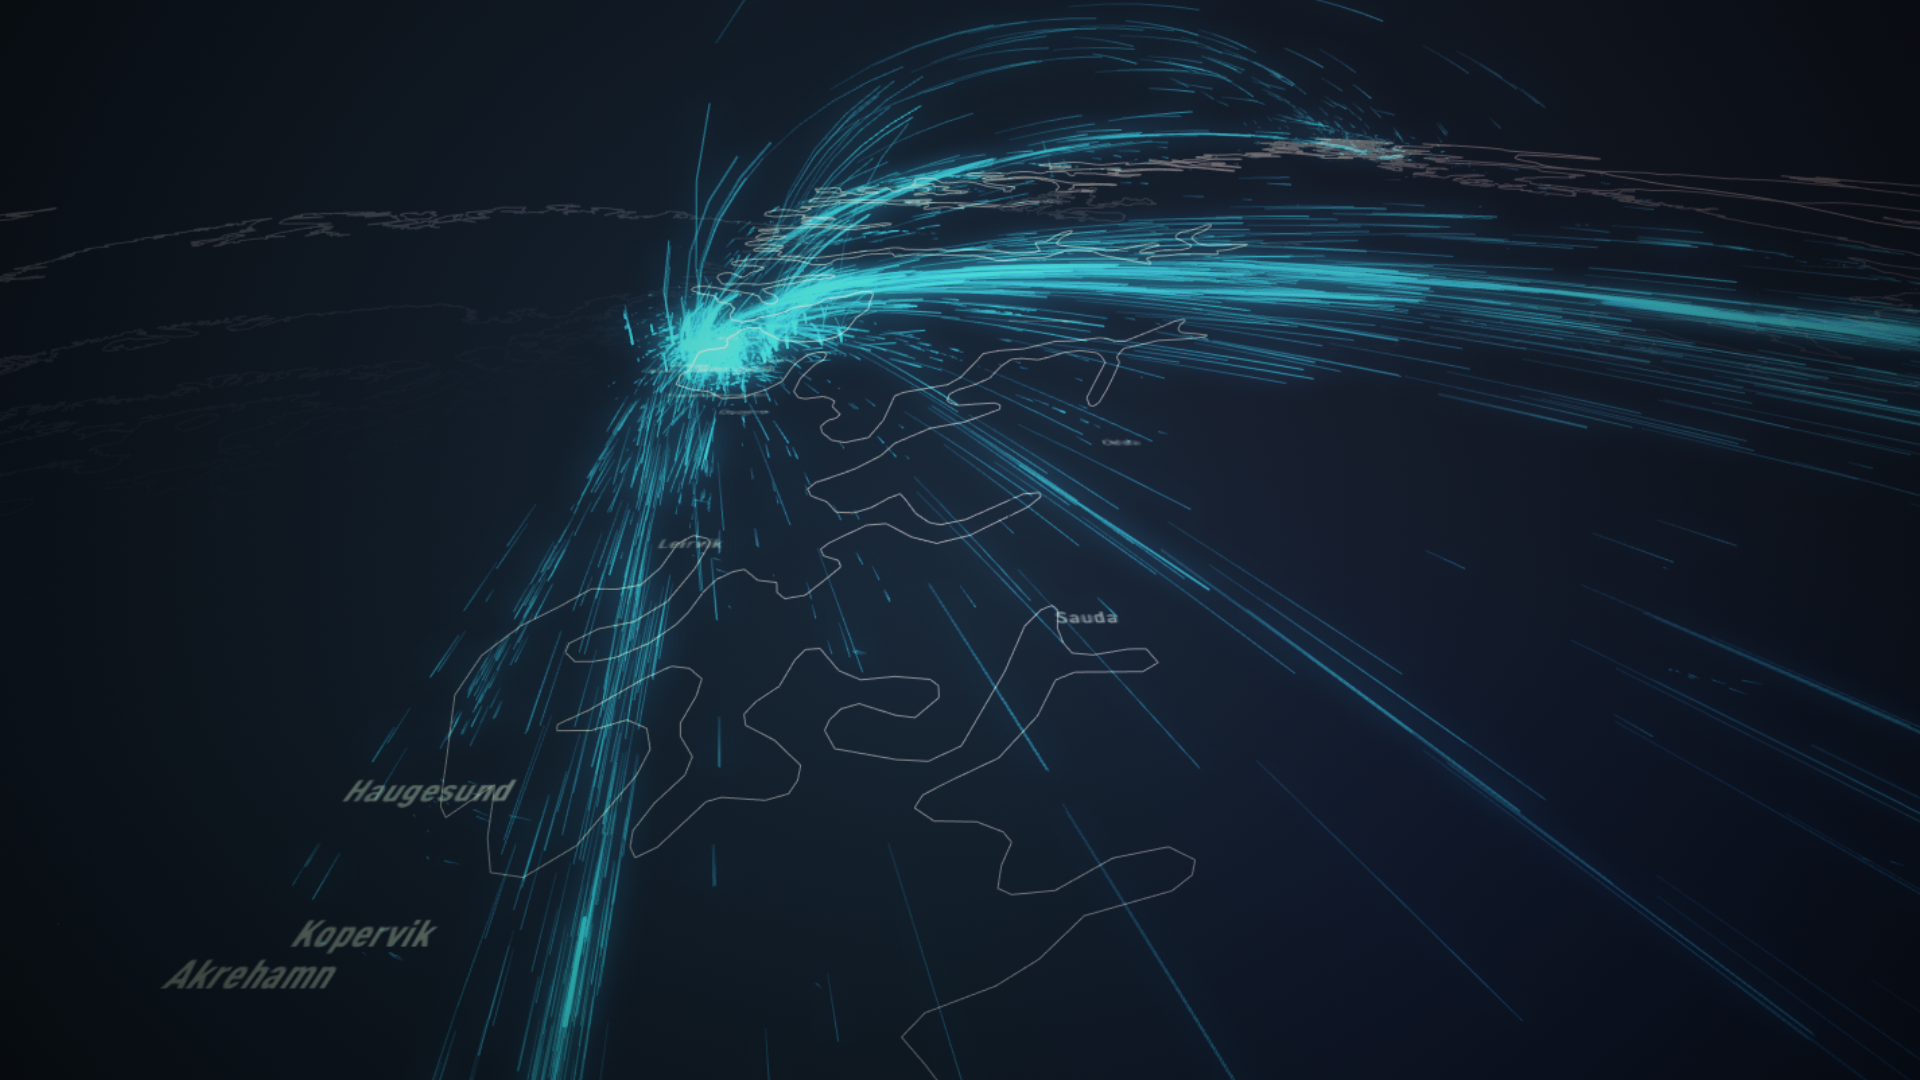
Showing everything
The data begs the question: if the patterns of everyone moving in one year could be compressed into one short animation, what would could it look like? If you want this visual answer in realtime and with a decent framerate the volume of information pushes the problem just North of what you can accomplish with Processing or interpreted languages. I don't have much experience with C++, but luckily I got to spend two weeks with a good friend and our families in a storm ravaged resort:

Simen has had plenty of experience writing low level code in building his open source CNC motion control GRBL software and could assist during a couple of late evenings in getting a quick prototype running with the Cinder OpenGL libraries. When running Word and the latest OSes computers may seem to running at approximately the same speed they did 10 years ago, but wonders have happenend when you get close enough to hardware.
Conclusion
When running at full clip the visualization is clearly lacking in terms of salient features, yet I find it interesting. Then again, I like looking at Pachinko machines and breaking waves – processes comfortably stuck between the random and the ordered. When slowing the animation down and filtering for certain demographies it becomes more useful. At its best laymen, like myself, can visually perceive facets of the national Norwegian migratory process that before were only available through the statistical calculations of researchers in demography.
Coverage
- Information Aethetics – Deluge: How 300.000 Norwegians Move House in a Year
- Flowing Data – Animation shows national migration patterns
- Guardian – How 300,000 people move home, animation
- FastCo Design – Watch As 300,000 Norwegians Move Across The Globe Like Ballistic Missiles
- Hacker News

Related projects


Other projects
-

PANDA
Supercolluder for the gig economy
-
Principal Components
Machine learning in search of the uncanny
-
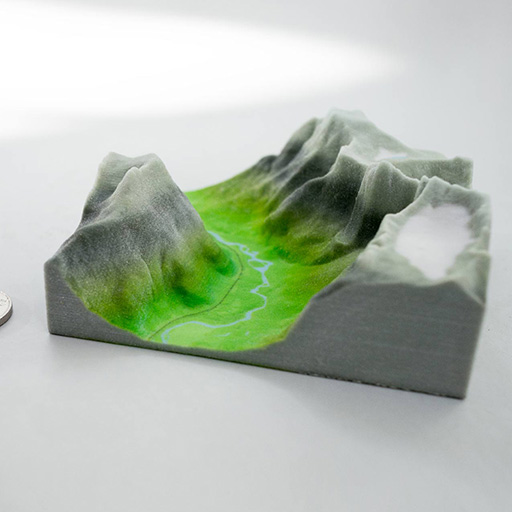
Terrafab
Own a small slice of Norway
-

OMA Website
Simple surface, intricate clockwork
-

Underskog
Friendly community for the Norwegian cultural fringe.
-
Mapfest!
Helping liberate Norwegian geodata
-

Chorderoy
Efficient text input for mobile and wearable devices
-

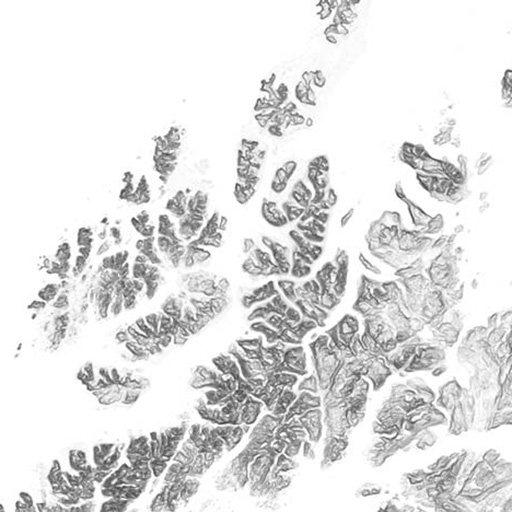
Intersections
Laser sintered topological maps for cars and social scientists